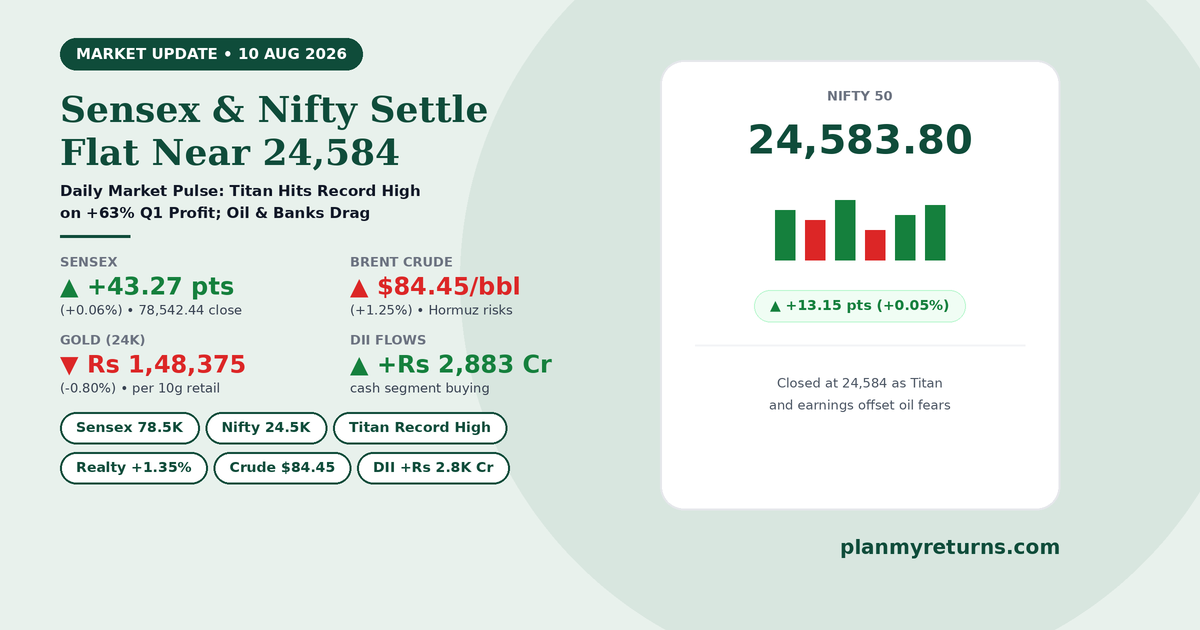
Today’s Overview: Indian stock markets closed flat on August 10, 2026, as robust corporate earnings and softer US labor data countered rising crude oil prices and global geopolitical tensions. The BSE Sensex gained 43.27 points to 78,542.44, while Nifty 50 added 13.15 points to 24,583.80. Titan’s stellar Q1 results boosted sentiment, but PSU bank selling restricted gains.
Today’s Top Finance Stories
1. Why Did Sensex and Nifty Close Flat on 10 August 2026?
What happened: Benchmark Indian stock market indices closed almost unchanged on Monday after a rangebound session. The BSE Sensex rose +43.27 points (+0.06%) to end at 78,542.44, while the Nifty 50 added +13.15 points (+0.05%) to settle at 24,583.80. Bank Nifty dipped -59.50 points (-0.10%) to 57,686.95.
Why does it matter: Investors weighed supportive triggers like strong Q1 corporate earnings and softer US labor data against lingering Middle East oil supply risks. Traders projecting long-term portfolio growth during consolidation phases can plan systematic investments using a SIP Calculator or calculate portfolio returns using a Lumpsum Calculator.
Key Takeaway: Rangebound trading near 24,580 reflects a balanced market where earnings resilience absorbs global energy headwinds.
2. What Drove Titan Company Shares to a Record High Today?
What happened: Consumer retail and jewellery major Titan Company surged +3.22% to close at ₹5,100.00 on 10 August, leading Nifty 50 gainers after reporting a 63% YoY increase in Q1 net profit to ₹1,777 crore.
Why does it matter: Robust wedding demand and strong store expansion drove revenue momentum. Investors planning big-ticket purchase goals or long-term wealth accumulation can evaluate step-up contribution targets with a Step-Up SIP Calculator.
Key Takeaway: Exceptional earnings execution and margin resilience make quality retail leaders market drivers during earnings season.
3. Policy and Global Watch: How Are US-Iran Talks and Crude Oil Prices Impacting Indian Stocks?
What happened: International Brent crude oil prices rose +1.25% to $84.45 per barrel on 10 August amid persistent uncertainty over US-Iran peace talks and shipping resumption through the Strait of Hormuz. The Rupee traded steady at 95.25 against the US Dollar.
Why does it matter: Higher international crude prices increase India’s import bill and affect energy-sensitive sectors. Investors evaluating real purchasing power growth against inflationary trends can use our Inflation Calculator.
Key Takeaway: Energy price fluctuations remain the primary external macro risk factor for domestic equities.
4. Why Did PSU Banking Stocks and State Bank of India Drag Markets?
What happened: Banking heavyweight State Bank of India (SBI) slipped -2.39% on 10 August, leading profit booking across PSU lenders as Nifty PSU Bank dropped nearly 1.85%. In contrast, Realty (+1.35%) and IT (+0.27%) sectors attracted buying support.
Why does it matter: Reallocation from banking into outperforming sectors like realty and IT kept market benchmarks balanced. Homebuyers checking property financing commitments can project monthly outflows using a Home Loan EMI Calculator.
Key Takeaway: Sector rotation into realty and technology shares cushioned market benchmarks against banking profit taking.
5. How Did Broader Markets and Midcaps Outperform the Benchmarks?
What happened: The Nifty Midcap 100 index advanced +0.62% to 63,855.70 on 10 August, while Nifty Smallcap 100 edged down -0.27%, demonstrating strong stock-specific momentum outside frontliners.
Why does it matter: Domestic Institutional Investors (DIIs) supported sentiment with net buying of +₹2,883.17 crore in cash equities. Taxpayers planning financial investments can compare annual liabilities using our Old vs New Tax Regime Calculator.
Key Takeaway: Strong DII institutional participation keeps broader market breadth active even when headline indices consolidate.
News & Stock Updates
Macro, Regulatory & Economy Updates
- Forex Reserves & Currency: RBI dollar supply interventions held USD/INR near 95.25 (+0.04%) despite elevated global oil prices.
- US Fed Rate Expectations: Softer US employment data reduced near-term US Fed interest rate hike concerns, stabilizing emerging market flows.
- Institutional Money Flows: Domestic Institutional Investors (DIIs) recorded net buying of +₹2,883.17 crore, while Foreign Institutional Investors (FIIs) posted net sales of -₹943.42 crore in the cash segment.
- SEBI Regulations: Joint exchange-depository inspections commenced to ensure price discovery across closing auction systems.
Corporate & Stock Action Buzzers
- Titan Company: Touched fresh record high of ₹5,100 after Q1 net profit surged +63% YoY to ₹1,777 crore.
- AstraZeneca Pharma: Reported a +31.9% YoY increase in consolidated Q1 net profit to ₹38 crore.
- Tata Consumer Products: Advanced +2.40% on strong volume growth in packaged food categories.
- Hero MotoCorp: Gained +2.40% following positive quarterly sales figures and premium motorcycle demand.
- State Bank of India (SBI): Declined -2.39% due to profit booking in PSU banking stocks.
- Bharat Forge & Bosch: Buzzed ahead of scheduled June-quarter earnings announcements.
Market Snapshot
Equity figures are official closing levels for 10 August 2026. Gold and silver rates shown are indicative 24K retail reference rates (10g and 1kg). Note that retail gold and silver prices vary across cities (e.g., Mumbai, Delhi, Chennai, Hyderabad, Bengaluru) due to local taxes/octroi, transportation costs, and jeweller margins. Crude and currency reflect round-the-clock evening rates.
Top Gainers & Losers Nifty 50, 10 August 2026
▲ Top 5 Gainers
- Titan Company +3.22%
Topped Nifty gainers on 63% YoY Q1 profit jump.
- Tata Consumer Products +2.40%
Advanced on volume expansion in FMCG segment.
- Hero MotoCorp +2.40%
Gained on strong quarterly sales momentum.
- Bajaj Finance +2.20%
Rebounded to close at Rs 1,105.00.
- Grasim Industries +1.70%
Selective buying in manufacturing counters.
▼ Top 5 Losers
- State Bank of India (SBIN) -2.39%
Led profit taking in PSU banking space.
- Eternal (Zomato) -1.50%
Mild correction after recent rally.
- ITC Limited -1.20%
Selective profit taking in FMCG heavyweights.
- Dr. Reddy’s Laboratories -1.13%
Marginal weakness across pharma sector.
- TCS -1.00%
Minor profit booking in IT frontliners.
Consolidation Phase
Meaning: A Consolidation Phase refers to a market condition where stock prices trade within a narrow, well-defined range without establishing a clear upward or downward trend as buying and selling pressures balance out.
Example: The Nifty 50 entered a consolidation phase around 24,584 on 10 August 2026 as strong Q1 earnings balanced rising crude oil prices.
Frequently Asked Questions
Why did the Indian stock market close flat on 10 August 2026?
The BSE Sensex rose 43.27 points (+0.06%) to 78,542.44 and Nifty 50 added 13.15 points (+0.05%) to 24,583.80 as positive Q1 earnings from Titan (+3.22%) and softer US labor data were offset by higher crude oil prices ($84.45/bbl) and PSU bank selling.
What pushed Titan shares to a record high today?
Titan Company shares gained over 3% to reach ₹5,100 after reporting a 63% YoY increase in Q1 net profit to ₹1,777 crore, driven by robust jewellery demand.
What is the current technical setup for Nifty 50?
Nifty 50 is consolidating above 24,500 support level, with immediate resistance positioned at 24,650.
Upcoming Market Catalysts to Watch
- US CPI Inflation Data: July inflation stats due later this week to provide clarity on Federal Reserve rate expectations.
- India IIP & Inflation Data: Domestic industrial production and CPI inflation figures scheduled for August 12.
- Q1 Earnings Announcements: Remaining June-quarter results from key F&O companies like Bharat Forge and Bosch.
Plan Your Financial Strategy with PlanMyReturns Tools
Explore free financial calculators to plan long-term investments, calculate loan EMIs, and optimize tax outflows:
- SIP Calculator: Calculate systematic investment returns for long-term wealth creation
- Stock Average Calculator: Calculate average share purchase costs during stock market consolidations
- Home Loan EMI Calculator: Estimate monthly installments and interest schedules on home loans
- Old vs New Tax Regime Calculator: Compare annual tax liabilities under both tax regimes
- Inflation Calculator: Estimate the impact of changing prices on household purchasing power
About PMR Pulse
PMR Pulse is PlanMyReturns’ daily educational market wrap designed to help beginner Indian investors understand why equity markets moved, how global events impact domestic finances, and how to make informed wealth creation decisions.
Disclaimer: Content on PMR Pulse is provided for general informational and educational purposes only and does not constitute financial or investment advice. Read our full disclaimer.