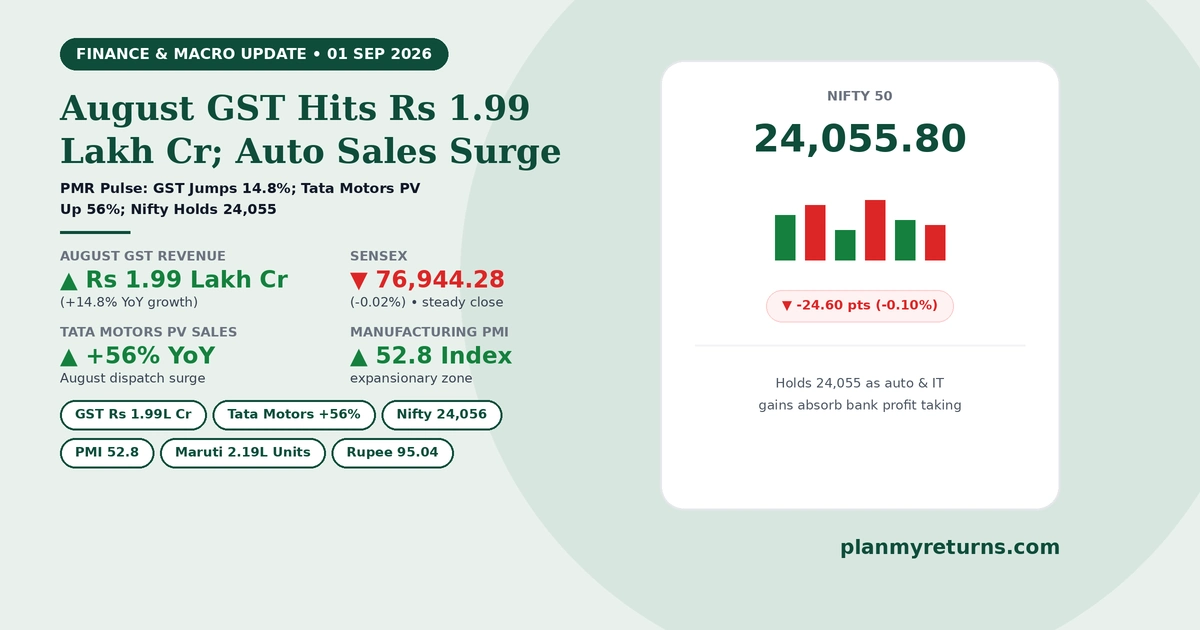
Today’s Overview: India’s economy registered strong festive momentum on September 1, 2026, as August GST collections jumped 14.8% to ₹1.99 lakh crore and Tata Motors PV dispatches surged 56%. Stock markets closed flat: the BSE Sensex dipped 13 points to 76,944.28 and Nifty held 24,055.80 as auto and IT gains absorbed banking profit taking.
Today’s Top Finance & Economy Stories
1. How Did August 2026 Gross GST Collections Jump 14.8% to Nearly Rs 2 Lakh Crore?
What happened: Official Ministry of Finance data released on 1 September showed gross Goods and Services Tax (GST) revenue collections rose 14.8% year-on-year to reach ₹1,99,235 crore in August 2026, accelerating from ₹1.73 lakh crore collected in August 2025. Domestic transactions grew robustly while import GST collections posted strong double-digit expansion.
Why does it matter: Sustained tax collection buoyancy confirms robust formal economic activity, strengthens government revenue health, and reduces public debt issuance. Taxpayers planning their annual financial investments can optimize tax deductions and calculate liabilities using our Old vs New Tax Regime Calculator.
Key Takeaway: Strong GST growth near ₹2 lakh crore reflects healthy consumer spending and corporate compliance across manufacturing and service sectors.
2. What Drove Tata Motors PV Sales to Surge 56% in August 2026 Auto Numbers?
What happened: Automobile manufacturers reported August 2026 monthly sales on 1 September: Tata Motors Passenger Vehicles dispatches jumped +56% YoY on surging electric vehicle and SUV deliveries. Market leader Maruti Suzuki India posted total sales of 219,220 units, while Mahindra & Mahindra (M&M) maintained double-digit utility vehicle growth ahead of the festive season.
Why does it matter: Upbeat dealer restocking and robust consumer booking orders for passenger vehicles signal strong festive demand across urban and rural markets. Vehicle buyers planning automotive purchases can project loan EMIs and interest schedules using a Car Loan Calculator.
Key Takeaway: Strong festive dispatches across passenger and electric vehicles drove outperformance across major automotive manufacturers.
3. How Did India’s August Manufacturing PMI Print at 52.8 and What Does It Indicate?
What happened: S&P Global / HSBC India Manufacturing Purchasing Managers’ Index (PMI) registered at 52.8 in August 2026, comfortably above the neutral 50.0 threshold to signal continuous factory output expansion, new domestic order inflows, and steady industrial hiring.
Why does it matter: Ongoing manufacturing expansion confirms that domestic factories are operating at healthy capacity utilization, reinforcing the momentum seen in India’s 7.80% Q1 GDP growth. Investors building long-term equity portfolios can model systematic wealth accumulation using a SIP Calculator or plan annual contribution growth with a Step-Up SIP Calculator.
Key Takeaway: Factory output remains securely in expansionary territory, supporting corporate earnings and industrial capital investments.
4. Why Did Sensex End Flat While Bank Nifty Slipped 615 Points on 1 September 2026?
What happened: Indian stock market benchmarks ended nearly unchanged on Tuesday after a choppy session. The BSE Sensex fell -12.99 points (-0.02%) to settle at 76,944.28, while the Nifty 50 dipped -24.60 points (-0.10%) to 24,055.80. Bank Nifty witnessed profit booking after yesterday’s 58,000 breakout, dropping -615.35 points (-1.06%) to 57,409.60.
Why does it matter: Sectoral rotation cushioned the main indices: strong gains in automotive leaders (Tata Motors +2.1%) and IT exporters (TCS +1.25%, HCL Tech +1.4%) absorbed selling in private lenders like Axis Bank (-1.95%) and Kotak Bank (-1.8%). Investors looking to average quality stock positions can calculate projections using a Stock Average Calculator.
Key Takeaway: Resilient auto and IT buying balanced banking sector consolidation, keeping Nifty 50 above the 24,050 support mark.
5. Policy and Global Watch: How Are Brent Crude at $91.22 and Rupee Strengthening Impacting Markets?
What happened: International Brent crude oil prices traded at $91.22 per barrel on 1 September amid persistent West Asia geopolitical friction. However, supported by India’s 7.80% GDP data and foreign institutional MSCI index rebalancing inflows, the Indian Rupee strengthened by 26 paise in early trade to settle near 95.04 per US Dollar.
Why does it matter: A stronger Rupee buffers the domestic economy against imported commodity inflation and eases foreign debt servicing burdens. Individuals measuring real household purchasing power against inflation trends can evaluate finances with an Inflation Calculator.
Key Takeaway: Strong macroeconomic fundamentals and currency appreciation provide a healthy cushion against elevated international crude oil prices.
6. What Are the Latest Personal Finance & Mutual Fund Trends for September 2026?
What happened: Domestic mutual funds witnessed sustained inflows as monthly systematic investment plan (SIP) contribution totals held firmly above ₹24,000 crore entering September. In fixed income, the Ministry of Finance reaffirmed steady interest rates for small savings schemes (PPF at 7.1%, Senior Citizens Savings Scheme at 8.2%), while leading commercial banks maintained attractive 1-year to 3-year fixed deposit rates between 6.8% and 7.3%.
Why does it matter: Balancing equity SIPs with assured return instruments ensures optimal asset allocation across market volatility. Investors evaluating lump-sum allocations across asset classes can project compounding returns using a Lumpsum Calculator or estimate compound interest with a Compound Interest Calculator.
Key Takeaway: Disciplined retail SIP contributions and stable government small savings rates offer balanced wealth creation opportunities for Indian savers.
Comprehensive Finance, Policy & Market Updates
Macroeconomic Indicators & Government Schemes
- August GST Revenue: Gross GST collections rose +14.8% YoY to ₹1,99,235 crore, driven by robust domestic trade and import GST receipts.
- August Auto Dispatches: Tata Motors PV sales surged +56% YoY; Maruti Suzuki dispatched 219,220 units on festive inventory buildup.
- Manufacturing PMI: S&P Global India Manufacturing PMI printed at 52.8 in August, signaling continued factory output expansion.
- Currency Market: Indian Rupee appreciated against the US Dollar to settle near 95.04 on strong Q1 GDP inflows and dollar liquidity.
- Government Small Savings: Small savings rates remain steady across PPF (7.1%), SCSS (8.2%), and Sukanya Samriddhi (8.2%) for the ongoing quarter.
Corporate, Banking & Stock Buzzers
- Tata Motors: Gained +2.10% to lead Nifty 50 gainers after reporting a 56% YoY jump in August PV sales.
- ITC Limited & HCL Tech: Advanced +1.65% and +1.40% respectively on steady defensive buying.
- TCS: Rose +1.25% to ₹2,313.10 as IT frontliners attracted value buying.
- Sun Pharma: Slipped -2.10% to ₹1,894.30 on profit taking after reaching record highs.
- Axis Bank & Kotak Bank: Slipped -1.95% and -1.80%, leading Bank Nifty consolidation.
- Tempsens Instruments: Basis of IPO allotment finalized with massive oversubscription; listing scheduled later this week.
Market & Macro Snapshot
Equity and macroeconomic figures reflect official releases as of 1 September 2026. Indicative 24K retail bullion reference rates: Gold ₹1,56,900/10g and Silver ₹2,39,600/1kg. Note that retail gold and silver prices vary across cities due to local taxes and jeweller margins. Crude and currency reflect round-the-clock rates.
Top Gainers & Losers Nifty 50, 1 September 2026
▲ Top 5 Gainers
- Tata Motors +2.10%
₹336.40 | Led Nifty gainers on 56% YoY August sales jump.
- ITC Limited +1.65%
₹275.60 | Advanced on resilient consumer staples demand.
- HCL Technologies +1.40%
₹1,332.80 | Value buying in IT software exporters.
- TCS +1.25%
₹2,313.10 | Rebounded on digital transformation deal wins.
- Maruti Suzuki India +0.95%
₹13,548.00 | Supported by 2.19 lakh unit monthly dispatches.
▼ Top 5 Losers
- Sun Pharma -2.10%
₹1,894.30 | Led Nifty decliners on profit booking.
- Axis Bank -1.95%
₹1,237.80 | Slipped after yesterday’s sharp banking rally.
- Kotak Mahindra Bank -1.80%
₹404.10 | Private banking sector consolidation.
- ICICI Bank -1.55%
₹1,390.20 | Dragged Bank Nifty lower.
- State Bank of India -1.40%
₹915.40 | PSU banking heavyweight profit taking.
Tax Buoyancy
Meaning: Tax Buoyancy measures the responsiveness of tax revenue growth relative to national GDP expansion, indicating an economy’s efficiency in generating tax receipts without raising tax rates.
Example: High tax buoyancy pushed India’s August 2026 gross GST collection up 14.8% to ₹1.99 lakh crore, supporting fiscal deficit consolidation.
Frequently Asked Questions
What was India’s GST collection for August 2026?
India’s gross GST collection jumped 14.8% year-on-year to ₹1,99,235 crore (nearly ₹1.99 lakh crore) in August 2026, driven by robust domestic trade and import GST expansion.
How did auto companies perform in August 2026 sales?
Tata Motors Passenger Vehicles dispatches surged 56% YoY on strong EV and SUV demand, while Maruti Suzuki India dispatched 219,220 units ahead of the festive season.
Why did the stock market close flat on 1 September 2026?
The BSE Sensex ended flat at 76,944.28 (-12.99 pts) and Nifty held 24,055.80 as gains in Tata Motors (+2.1%) and IT exporters absorbed profit booking in private banking stocks.
Upcoming Market & Economic Catalysts to Watch
- India Services PMI: S&P Global India Services PMI data due on September 3.
- Tempsens Instruments Listing: Stock market debut on BSE and NSE scheduled for September 3.
- AMFI August Mutual Fund Data: Official monthly equity fund inflows and SIP contribution totals.
Plan Your Financial Strategy with PlanMyReturns Tools
Explore free financial calculators to plan long-term investments, calculate loan EMIs, and optimize tax outflows:
- SIP Calculator: Calculate systematic investment returns for long-term wealth creation
- Car Loan Calculator: Calculate monthly installments and loan schedules for new vehicle purchases
- Home Loan EMI Calculator: Estimate monthly installments and interest schedules on home loans
- Old vs New Tax Regime Calculator: Compare annual tax liabilities under both tax regimes
- Inflation Calculator: Estimate the impact of changing prices on household purchasing power
About PMR Pulse
PMR Pulse is PlanMyReturns’ daily educational finance wrap designed to help beginner Indian investors understand macroeconomic indicators, government schemes, mutual funds, and market movements to make informed wealth creation decisions.
Disclaimer: Content on PMR Pulse is provided for general informational and educational purposes only and does not constitute financial or investment advice. Read our full disclaimer.