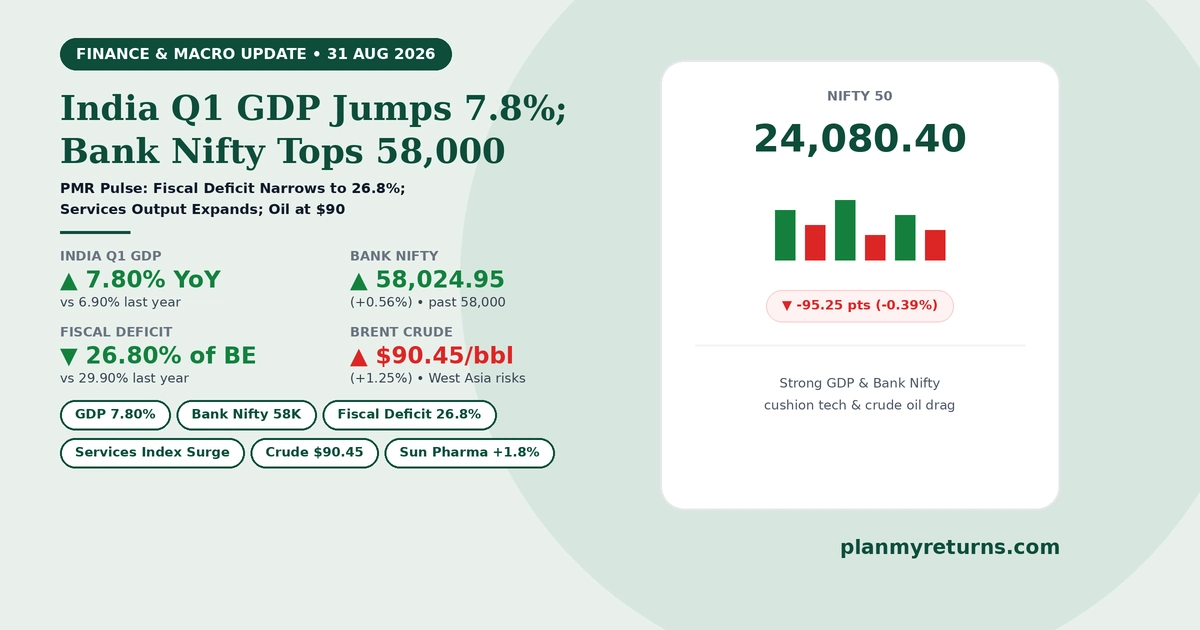
Today’s Overview: India’s economy demonstrated strong growth momentum on August 31, 2026, as Q1 GDP surged 7.80% and the fiscal deficit narrowed to 26.80% of annual estimates. Stock benchmarks closed mixed: Bank Nifty rallied past the historic 58,000 milestone (+0.56%), while the BSE Sensex dipped 307 points and Nifty held 24,080 amid IT profit booking and $90 crude oil.
Today’s Top Finance & Economy Stories
1. How Did India’s Q1 GDP Growth Surge to 7.80% YoY and What Does It Mean for Indian Households?
What happened: Official Ministry of Statistics and Programme Implementation (MoSPI) data released on 31 August confirmed India’s Gross Domestic Product (GDP) expanded 7.80% year-on-year during the April-June quarter of FY27, accelerating from 6.90% recorded in the same period last year. High manufacturing output, expanding construction, and robust financial services activity led the acceleration.
Why does it matter: Accelerating economic growth supports real wage growth, increases corporate profit pools, and underpins long-term capital compounding. Retail investors planning disciplined long-term wealth creation can model systematic investments with a SIP Calculator or plan annual contribution step-ups using a Step-Up SIP Calculator.
Key Takeaway: Strong 7.80% GDP expansion positions India as the fastest-growing major global economy, creating a solid fundamental tailwind for domestic equity compounding.
2. Why Did India’s Fiscal Deficit Narrow to 26.80% of Budget Estimates in April-July?
What happened: Official data from the Controller General of Accounts (CGA) released on 31 August showed the central government’s fiscal deficit narrowed to 26.80% of annual budget estimates (BE) for April-July 2026, marking a significant improvement from 29.90% reported in the corresponding period of the previous year.
Why does it matter: Higher tax buoyancy across direct income tax, steady corporate taxes, robust GST collections, and higher non-tax dividend receipts from public institutions kept fiscal consolidation on track. Lower borrowing requirements reduce pressure on sovereign bond yields, keeping bank interest rates stable. Taxpayers evaluating tax regimes and financial deductions can compare annual liabilities using our Old vs New Tax Regime Calculator.
Key Takeaway: Prudent fiscal management supports sovereign balance sheet strength, curbing inflationary pressures and stabilizing domestic borrowing costs.
3. What Drove 18 Out of 19 Sectors in the Index of Services Production (ISP) to Rise in June 2026?
What happened: The central government published the Index of Services Production (ISP) for June 2026, indicating broad-based operational expansion across the service economy where 18 out of 19 sub-sectors grew. Leading growth drivers included real estate services, retail trade, and wholesale trade, with air transport being the only sub-sector experiencing a marginal decline.
Why does it matter: The services sector generates over 54% of India’s Gross Value Added (GVA); widespread growth in retail and property transactions reflects strong disposable income and steady consumer demand. Homebuyers evaluating residential property financing can estimate monthly repayment schedules using a Home Loan EMI Calculator.
Key Takeaway: Broad expansion across 18 service sub-sectors confirms sustained domestic consumption demand and active property market momentum.
4. How Did Bank Nifty Surge Past the Historic 58,000 Milestone Today?
What happened: The Bank Nifty Index surged +320.60 points (+0.56%) on 31 August to finish at 58,024.95, marking a historic breakout above the psychological 58,000 barrier. Private lenders Axis Bank (+1.75% to ₹1,262.40) and Kotak Mahindra Bank (+1.20% to ₹411.50) led institutional buying.
Why does it matter: Expanding credit disbursement volumes, stable non-performing asset (NPA) ratios, and deposit growth resilience continue to make banks the primary balance sheet pillar of the Indian market. Investors looking to cost-average portfolio holdings can evaluate average acquisition prices using a Stock Average Calculator.
Key Takeaway: Strong retail loan demand and healthy credit quality continue to make private banking heavyweights the primary driver of domestic market strength.
5. Policy and Global Watch: How Are Brent Crude Above $90 and IT Sector Profit Booking Impacting Markets?
What happened: International Brent crude oil prices rose +1.25% to $90.45 per barrel on 31 August amid renewed West Asia geopolitical friction and ongoing transit halts in the Strait of Hormuz. Concurrently, the Nifty IT Index tumbled -1.79% (down 624.80 pts) as Infosys (-2.45% to ₹1,085) and TCS (-2.10% to ₹2,284.50) faced institutional selling, pulling the BSE Sensex down 307.24 points to 76,957.27 and Nifty 50 to 24,080.40 (-0.39%).
Why does it matter: Crude oil above $90 increases national fuel import bills and puts pressure on the Rupee (USD/INR at 95.84), while IT reallocation reflects cautious enterprise tech spending commentary from global peers. Individuals tracking the impact of commodity inflation on family purchasing power can use an Inflation Calculator.
Key Takeaway: High energy prices and tech valuation adjustments keep broad market indices rangebound near 24,080 support.
6. What Drove Sun Pharma, Nestle India, and Healthcare Shares to Outperform Today?
What happened: Healthcare bellwether Sun Pharma surged +1.85% to reach a fresh milestone of ₹1,935.00, leading Nifty 50 gainers on 31 August on strong global specialty formulations demand. Packaged food major Nestle India gained +1.40% to ₹2,185.00 on resilient rural packaged foods demand.
Why does it matter: Defensive consumer staples and specialty pharmaceuticals provide essential earnings visibility during volatile macro environments. Investors making one-time lump-sum equity allocations during sector rotations can project compounding returns using a Lumpsum Calculator.
Key Takeaway: Strong institutional accumulation in healthcare and consumer staples offered effective downside protection against broader market declines.
Comprehensive Finance, Policy & Market Updates
Macroeconomic Indicators & Government Schemes
- India Q1 GDP Growth: India’s GDP grew 7.80% YoY in the April-June 2026 quarter (Q1 FY27), accelerating from 6.90% last year, powered by manufacturing, construction, and services output.
- Fiscal Deficit Consolidation: Central fiscal deficit narrowed to 26.80% of annual budget estimates in April-July from 29.90% last year, backed by strong direct tax and GST receipts.
- Index of Services Production (ISP): Ministry of Commerce data showed 18 out of 19 service sub-sectors expanded in June 2026, led by real estate, retail trade, and wholesale trade.
- Small Savings & Pension Schemes: Ministry of Finance maintained prevailing interest rates across small savings instruments (PPF at 7.1%, Senior Citizens Savings Scheme at 8.2%, Sukanya Samriddhi at 8.2%) with steady monthly NPS subscription growth.
- Mutual Funds & SIP Inflows: Domestic mutual fund equity inflows remained robust as monthly systematic investment plan (SIP) contributions held above ₹24,000 crore milestones.
Corporate, Banking & Stock Buzzers
- Bank Nifty Milestone: Crossed the 58,000 mark for the first time, closing at 58,024.95 (+0.56%) led by Axis Bank (+1.75%) and Kotak Bank (+1.20%).
- Sun Pharma: Reached a new record high of ₹1,935.00 (+1.85%), leading Nifty 50 gainers on specialty formulations sales.
- Nestle India: Rose +1.40% to ₹2,185.00 on resilient packaged consumer food demand.
- Power Grid Corporation: Added +1.10% to ₹269.40 following transmission asset expansion.
- Infosys & TCS: Dropped -2.45% and -2.10% as global tech spending caution weighed on IT exporters.
- Tata Steel: Slipped -1.65% to ₹186.20 on international metal price consolidation.
Market & Macro Snapshot
Equity and macroeconomic figures reflect official releases as of 31 August 2026. Indicative 24K retail bullion reference rates: Gold ₹1,56,850/10g and Silver ₹2,39,800/1kg. Note that retail gold and silver prices vary across cities due to local taxes and jeweller margins. Crude and currency reflect round-the-clock rates.
Top Gainers & Losers Nifty 50, 31 August 2026
▲ Top 5 Gainers
- Sun Pharma +1.85%
₹1,935.00 | Led Nifty gainers on specialty medicine demand.
- Axis Bank +1.75%
₹1,262.40 | Powered Bank Nifty past 58,000 milestone.
- Nestle India +1.40%
₹2,185.00 | Advanced on resilient rural packaged foods demand.
- Kotak Mahindra Bank +1.20%
₹411.50 | Steady buying across private banking leaders.
- Power Grid Corporation +1.10%
₹269.40 | Supported by transmission network capex plans.
▼ Top 5 Losers
- Infosys -2.45%
₹1,085.00 | Led Nifty decliners as Nifty IT fell 1.8%.
- TCS -2.10%
₹2,284.50 | Profit booking across large-cap IT exporters.
- Wipro -1.80%
₹472.10 | Slipped alongside software export peers.
- Tata Steel -1.65%
₹186.20 | Metal sector consolidation.
- Bharti Airtel -1.50%
₹1,885.00 | Telecom heavyweight profit taking.
Index of Services Production (ISP)
Meaning: The Index of Services Production (ISP) is an official macroeconomic indicator that tracks the monthly volume of output across key service industries (such as retail trade, real estate, financial services, and transportation), quantifying growth in the service economy.
Example: The June 2026 ISP report released on 31 August showed 18 out of 19 service sub-sectors expanded, led by retail trade and real estate.
Frequently Asked Questions
What was India’s Q1 GDP growth for April-June 2026?
India’s GDP grew 7.80% year-on-year in the April-June 2026 quarter (Q1 FY27), up from 6.90% in the same quarter last year, driven by strong manufacturing and service activities.
How did India’s fiscal deficit perform in April-July 2026?
India’s fiscal deficit narrowed to 26.80% of annual budget estimates during April-July 2026, improving from 29.90% in the same period last year due to strong direct tax and GST receipts.
What milestone did Bank Nifty reach on 31 August 2026?
Bank Nifty surged past the 58,000 milestone to close at 58,024.95 (+0.56%), driven by institutional buying in Axis Bank (+1.75%) and Kotak Mahindra Bank (+1.20%).
Upcoming Market & Economic Catalysts to Watch
- Auto Monthly Sales Figures: August automobile dispatch numbers scheduled for release on September 1.
- India Manufacturing PMI: S&P Global India Manufacturing PMI data due on September 1.
- AMFI Mutual Fund Data: August mutual fund flow numbers and SIP contribution totals due in early September.
Plan Your Financial Strategy with PlanMyReturns Tools
Explore free financial calculators to plan long-term investments, calculate loan EMIs, and optimize tax outflows:
- SIP Calculator: Calculate systematic investment returns for long-term wealth creation
- Stock Average Calculator: Calculate average share purchase costs during stock market consolidations
- Home Loan EMI Calculator: Estimate monthly installments and interest schedules on home loans
- Old vs New Tax Regime Calculator: Compare annual tax liabilities under both tax regimes
- Inflation Calculator: Estimate the impact of changing prices on household purchasing power
About PMR Pulse
PMR Pulse is PlanMyReturns’ daily educational finance wrap designed to help beginner Indian investors understand macroeconomic indicators, government schemes, mutual funds, and market movements to make informed wealth creation decisions.
Disclaimer: Content on PMR Pulse is provided for general informational and educational purposes only and does not constitute financial or investment advice. Read our full disclaimer.